 Ελληνικά
 English
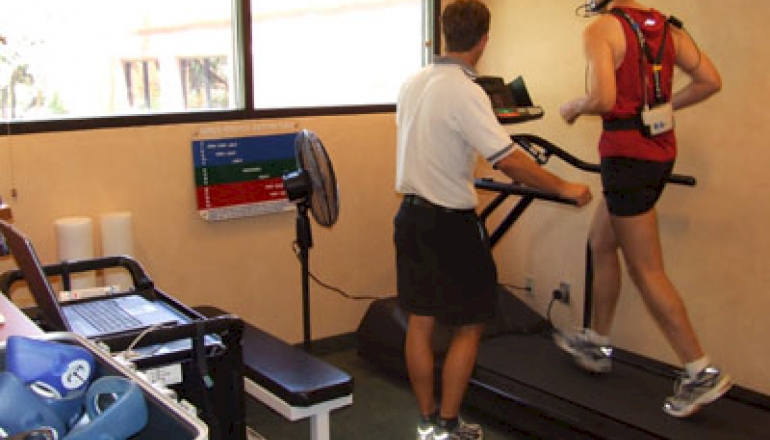
Testing »
See the latest specified protocols observed in international literature with the help of special testing machines in a lab environment.
See the latest specified protocols observed in international literature with the help of special testing machines in a lab environment.


VO2max represented the single most used physiological variable in soccer fitness testing during 1980-2000 (1). A range of has been proposed as a “cut-off” threshold for a successful elite male soccer player (1, 2); however there is considerable variation in VO2max values among professional soccer players from different countries (Table 1).
|
Study |
Sample (n) |
Country |
Mean±SD (mL·kg–1·min–1) |
|
Sporis et al, 2009 |
270 |
Croatia |
60.1±2.3 |
|
Ziogas et al, 2010 |
53 |
Greece |
58.8±3.3 |
|
Arnasson et al, 2004 |
225 |
Iceland |
62.5±4.8 |
|
Haugen & Seiler, 2015 |
598 |
Norway |
63.0±3.0 |
Table 1. Mean±SD VO2max values in large cohorts of professional soccer players.
It appears that VO2max alone can not discriminate between players of different status in large cohorts of players (4, 6, 7). For example in a pre-season testing of 129 professional soccer players, VO2max could not discriminate playing standard (Div A=58.8±3.3 mL·kg–1·min–1; Div B=56.4±3.7 mL·kg–1·min–1; Div C=57.6±3.2 mL·kg–1·min–1) (4). More recently, it was observed that VO2max could not discriminate among national-team players, 1st and 2nd division players, in a cohort of 1545 players (7). From a training perspective VO2max can increase up to 6% (58.7±4.4 mL·kg–1·min–1 to 61.2±4.1 mL·kg–1·min–1) in high level professional players which requires accumulating 7.3±2.9% of the total training time during an 8 week pre-season period at high-intensities (≥90% HRmax) (8). However further increase during the in-season is not always evident (7, 9). VO2max has a typical error of 2.0-3.4% and a smallest worthwhile change of 1.5%, therefore a likely “true” positive change for a single athlete should be between 3.5-5% (10). This would require a player entering the competitive season with a VO2max of 60 mL·kg–1·min–1 to produce a mid-season value of 62.1-63.0 mL·kg–1·min–1. Despite optimization in high intensity aerobic training (11), striving to produce such increases during the in-season may come at the expense of other important fitness attributes (6).
Key points
REFERENCES
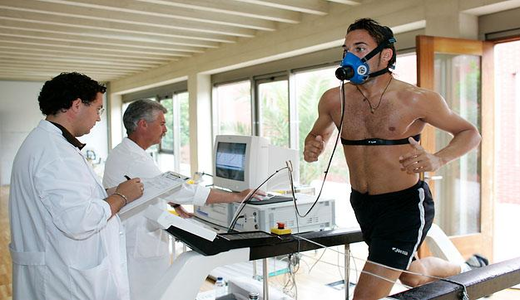
Laboratory assessment of endurance capacity in soccer players typically involves a treadmill at progressively increasing velocities until volitional exhaustion (1). During this test gas exchange data and blood lactate values are being collected and are used to define a range of physiological markers (lactate thresholds, maximal oxygen uptake) along with their corresponding velocities (1).
Field assessment of the speed indices involves, amongst other parameters, the assessment of maximal speed (2). The continuum of the velocities associated with the above physiological parameters as well as the inclusion of maximal sprinting speed creates a locomotor profile of the player (3) that takes into consideration submaximal and maximal physiological markers as well as neuromuscular markers (Figure 1).

The locomotor profile can be used to assess the contribution from anaerobic sources during the various drills. For example two players with same vVO2max but different MSS will be taxed differently during a 6 min 15:15 running based HIIT at 120%vVO2max with passive rest.
Specifically despite having the same vVO2max this workout will be more intense for the player with the lower MSS. This is due to the fact that the absolute intensity of the drill (e.g. ~22 km·h-1) will be closer to upper limit of his locomotor profile. Therefore despite that the drill is taxing the aerobic mechanisms of the players to an equal extend, the player with the lower MSS is experiencing a higher anaerobic load (3, 4).
REFERENCES

Aerobic capacity is crucial for the performance in football players, and its assessment is one of the most important ergometric tests in the early stages of pre-season (2,6). In the modern football the distance covered during a match in elite football players range between 10 – 13Km (2,4) and with mean values for VO2max between 55- 75 mL · kg–1 · min (6,2,4), it has been proposed that a VO2max of > 60 mL · kg–1 · min should be the minimum threshold in order to perform in top class contemporary football (6,2,4). However, there many other biochemical factors that should be taken into consideration in football players which their importance and usefulness are crucial to make final conclusions about the fitness levels and the design of a particular training program based on the results. One of the most well know parameters in the athletic world is the anaerobic threshold or lactate threshold. Why this parameter is such of an importance? Because its concentration in the blood is being used as an indicator of aerobic and anaerobic energy production (4,13), it helps to examine the rate of production and its removal from the blood (12), the tolerance to lactate (9), evaluate physical fitness as well as identify any adaptations might occur after following a specific training plan are some of the information can be collected from the test.
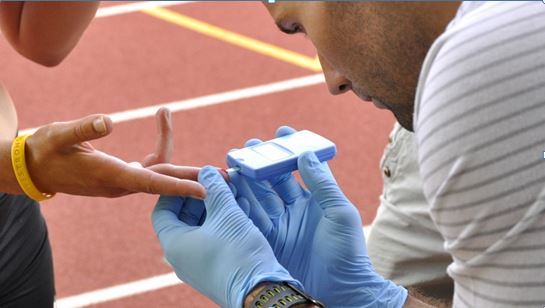
The assessment can be carried out in the laboratory (treadmill) or outdoor (football court). In a laboratory environment the test protocol consists of several incremental stages (4-7, depends on the sport and the athlete) with a small break between the stages in order to collect capillary blood either from the finger (Picture 1) or the ear lobe. Then, the treadmill speed increasing gradually until volitional exhaustion of the athlete where VO2max and vVO2max can be determined as well. After the completion of the test, the anaerobic threshold can be detected with various methods. The diagram bellow shows the determination of 2 thresholds, the LT1 (around 2 mmol L −1) and LT2 (between 3.5 and 4 mmol L −1 ).
L1 represents the velocity (vLT1) / intensity where the main energy source derived from the aerobic system. L2 shows the velocity (vLT2) / intensity and the transition from aerobic to the anaerobic system and also indicating the upper limit of the steady state between lactate production and removal. Based on these results the sport scientist can develop a training program, monitor the intensity of the players based on the blood lactate results and most importantly work at the right intensities as well as at the right amount of time.
Based on the literature, a football player with high anaerobic threshold would be able to cover more distance in high intensity without accumulating much lactic acid in the blood (6). At the table below, various of velocities at the anaerobic threshold can be seen in professional football players from different leagues and countries.

Table 1. Mean ± SD values of velocity at LT2 in various studies in football players.
|
STUDY |
COUNTRY |
NUMBER OF PARTICIPANTS |
LEVEL |
VELOCITY AT LT2 (Km/h) |
|
Casajus |
Spain |
15 |
Professional |
12.4 ± 1.5 |
|
Santos et al |
Portugal |
44 |
Professional |
14.2 ± 1.4 |
|
Balikian et al. |
Brazil |
25 |
Professional |
13.5 ± 0.9 |
|
Ziogas et al. |
Greece |
53 |
Professional |
13.2 ± 0.7 |
Lactate threshold has shown to strongly correlated to endurance performance, and more emphasis has been placed in comparison to VO2max the recent years. Also, measurement of LT should implemented as a tool during in competitive period for the investigation of aerobic fitness (4,5,1,13). The main reason for this is because LT is associated with peripheral adaptations such as an increase in capillary density and in the ability to transport hydrogen ions and it is more sensitive to changes in training regimens, whereas VO2max is basically limited to central factors (Cardiac Output), where it makes it harder to improve (6). Lastly, LT assessment is one of the gold standard methods to evaluate the aerobic and anaerobic fitness and is a valid as well as reliable tool in monitoring changes in aerobic capacity in football players. However, it should not be a primarily criterion for a player selection as there are other important determinants that should be taken into consideration to define overall a player’s fitness.
REFERENCES:
5)Chin, M, K., Lo, Y, S., Li, C, T., So, C, H. (1992). Physiological profiles of Hong Kong élite soccer players. British Journal of Sports Medicine, 26(4), 262-266.
7)Hamilton, A, L., Nevill, M, E., Brooks, S., & Williams, C. (1991). Physiological responses to maximal intermittent exercise: differences between endurance trained runners and games players. Journal of Sports Science, 9(4), 371-382.
8)Jemni, M., Prince, M, S., & Baker, J, S. (2018). Assessing Cardiorespiratory Fitness of Soccer Players: Is Test Specificity the Issue? A Review. Journal of Sports Medicine - Open, 4(1),
9)Nilsson, J., & Cardinale, D. (2015). Aerobic and anaerobic test performance among elite male football players in different team positions. Journal of Sport Science, 6(2), 73-92.
10)Reily, T., Bangsbo, J., & Franks, A. (2000) Anthropometric and Physiological predispositions for elite soccer. Journal of Sports Science, 18(9), 669-683.
11)Strudwick, A, Reily, T., & Doran, D. (2002). Anthropometric and fitness profiles of elite players in two football codes. Journal of Sports Medicine and Physical Fitness, 42(2), 239-242.
12)Tonnessen, E., Hem, E., Leirstein, S., Haugen, T., & Seiler, S. (2013). Maximal aerobic power characteristics of male professional soccer players, 1989-2012. International Journal of Sports Physiology Performance, 8(3), 323-329.
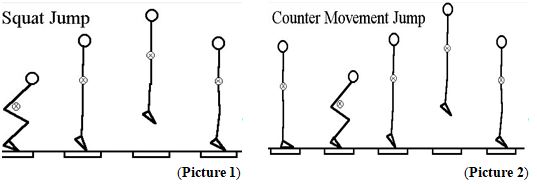
In football it is well known that the ability to have explosiveness and power at the lower extremities in a football player are very important factors in performance, as the nature of the sport requires many explosive actions during a match (1,3). Also, the jumping ability, as an expression of power, is a basic factor for a good performance in the specific sport (2,7,9). The reason for this is that the football player requires to perform fast and jump high for a successful header and in order to achieve that, it also requires high and explosive jumping ability. One way to evaluate jumping ability, lower body power and neuromuscular coordination, is the use of vertical jump test. It’s a simple, practical, valid and very reliable measure which can provide us with very useful information and work on any weakness might present. The test has been measured using force platforms or led bar systems connected to a laptop. The most widely used techniques by researchers are Squat Jump (SJ) and Counter – Movement Jump (CMJ). Both are useful for assessing athletic performance and each of the test provides us with different information due to their different techniques. The SJ (Picture 1) is used as a measure of lower body concentric strength / power and is performed in a semi squat position while CMJ (Picture 2) is used as a measure of lower body reactive strength / power (performed with counter movement), the ability of the neuromuscular coordination and the coordination among muscles (stretch and shortening cycle, (SCS) (1,5,7).

Why is this test useful and what is the conclusion? Research has shown that these tests have relationship with sprint performances (3), acceleration in a sprint (4), greater flight time (6), and increased 1RM maximal strength in squat (9). The jumping ability in football players varies between 47.8 – 60.1 cm. Based on the literature the vertical jumping profile of a football player should be at least 45 cm in a competitive level (2).
Taking these information into consideration, the strength and conditioning coach may design or develop a training plan based on the athletes results as well as for the whole team in order to enhance performance. A large proportion of literature has conducted variety of studies in improving jumping ability and also what kind of exercise training is more efficient. The vertical jumps are explosive movements which require fast action and strength in the lower extremities (3,5). For this reason, plyometric exercises have been proposed and have attracted the attention of sport scientists for the reasons mentioned earlier above. Several research studies have shown that plyometric exercise develop the power and explosiveness in athletes (7,8,9). The table below illustrates various of training methods in enhancement of jumping ability alongside with other parameters. It is clear that plyometric exercise training positively contributing to improved performance after conducting numerous of tests.
Table 1. Values for each exercise training program and its effect on different parameters
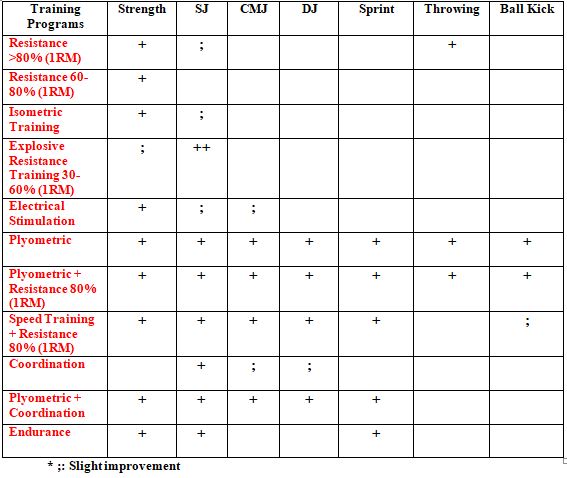
Lastly, the vertical jump assessment can provide us with useful information regarding athlete jumping ability as well as other variables, where strengths and weaknesses can be detected and an appropriate training plan can be designed in order to develop sport specific characteristics. Based on the research, it can be concluded that applying plyometric exercise training into a football training program can induce significant improvements in various parameters.
REFERENCES: